Mortality studies with DaTraV data
The evaluation by the Robert Koch Institute is based on DaTraV data analysed by the Health Data Lab (previously Data Preparation Centre, "Datenaufbereitungsstelle"). For the first time it was possible to calculate the mortality in Germany for persons with diabetes in comparison to persons without diabetes by analysing the claims data of all persons insured within the statutory health insurance system. Initially, it could be shown that the general mortality in the claims data of all statutorily insured persons corresponds well with the general mortality of the total population over 30 years of age for both sexes. Due to the completeness of this data, the determined mortality rates can also be assumed for the total population of Germany, thus forming the basis for reliable classifications in terms of time.
Source: These results are fully available and presented in the RKI - Diabetes surveillance. RKI - Diabetes surveillance.
Results:
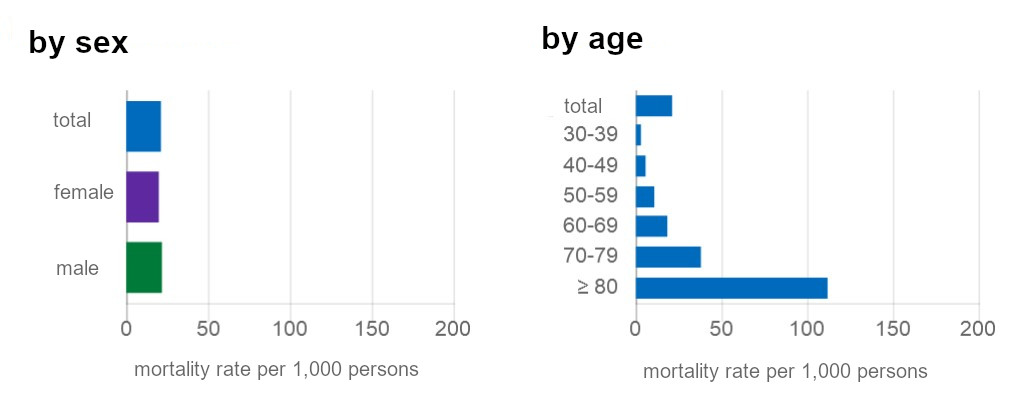
Related to 1,000 persons, the mortality rate in 2014 for women over 30 years with diabetes was 20.0 and for men with diabetes and of the same age range it was 21.9. Thus, the mortality rates per 1,000 persons are significantly higher than both those for women aged 30 years and older (12.2) and for men aged 30 years and older (12.8). With increasing age, there is a clear convergence of mortality rates between persons with and without diabetes. In the age group of persons 30-39 years old, the mortality rate per 1,000 persons is 3.1 in the group with diabetes and thus 5 times higher compared to 0.55 in the group without diabetes. The relative gap in mortality rates is reduced in the 50-59 year age group being 10.9 in the group with diabetes and 3.9 in the group without diabetes and thus 2.8 times higher in the group with diabetes. Finally, the mortality rate per 1,000 persons in the age group of 80 years and older is 112.0 for persons with diabetes and 86.3 for persons without diabetes. This further reduces the relative gap in mortality rates between the two groups, showing a 1.3-fold increase in mortality per 1,000 persons for the group with diabetes.
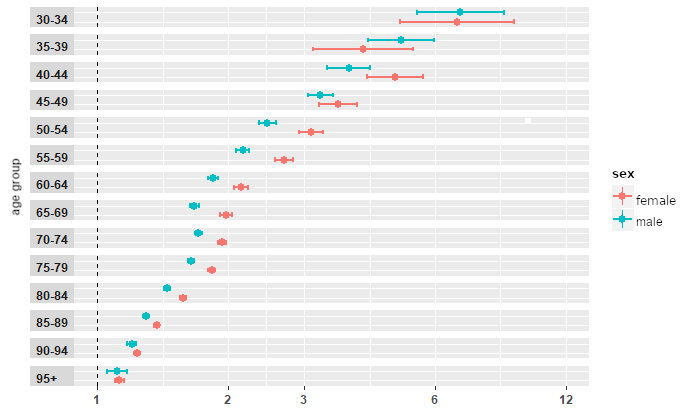
Figure 1
Relative mortality rate (95% CI) for persons aged 30 years and older with diabetes compared with persons without diabetes by sex and age groups. Explanation: A mortality risk of 1 (dashed vertical line) would mean that the mortality risk of persons with and without diabetes is the same. Values greater than 1 indicate a higher risk of death for persons with diabetes.
Source: These results are fully available and presented in the RKI - Diabetes surveillance. RKI - Diabetes surveillance.
Figure 2
Flowchart for selection of study population. Exclusion criteria with corresponding sample sizes
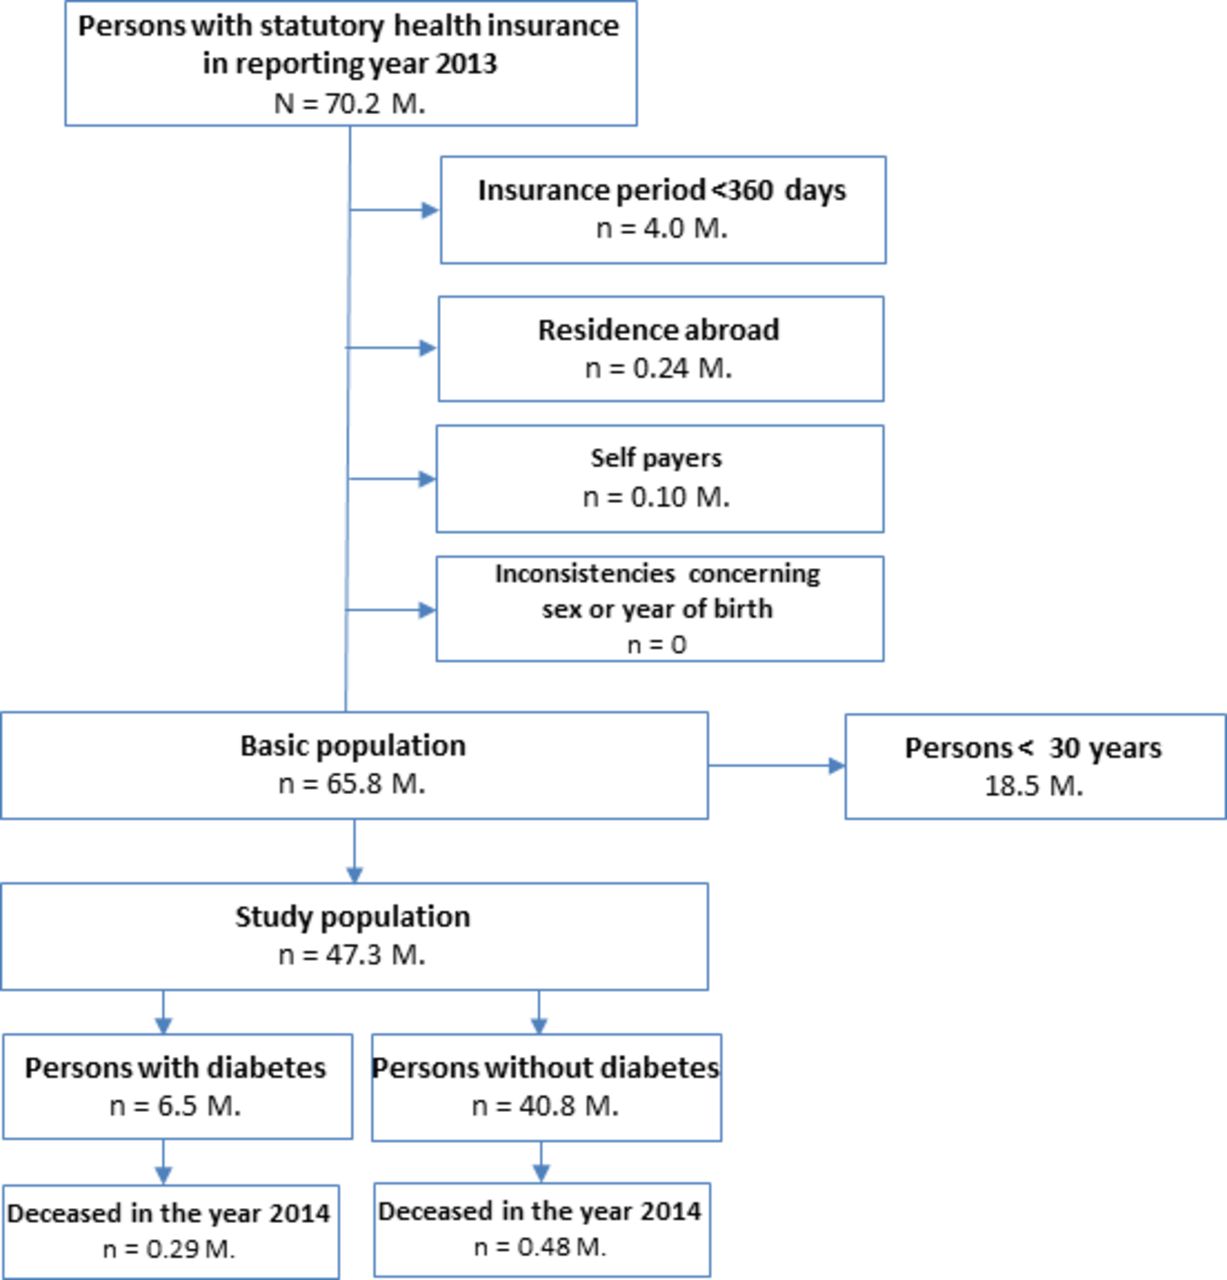
Figure 3
Age-specific mortality rates per 100,000 persons stratified by sex for the year 2014 as obtained from official cause-of-death statistics (Destatis) and claims data (DaTraV). The blue line indicates results from official statistics; the green line indicates results from the DaTraV dataset.
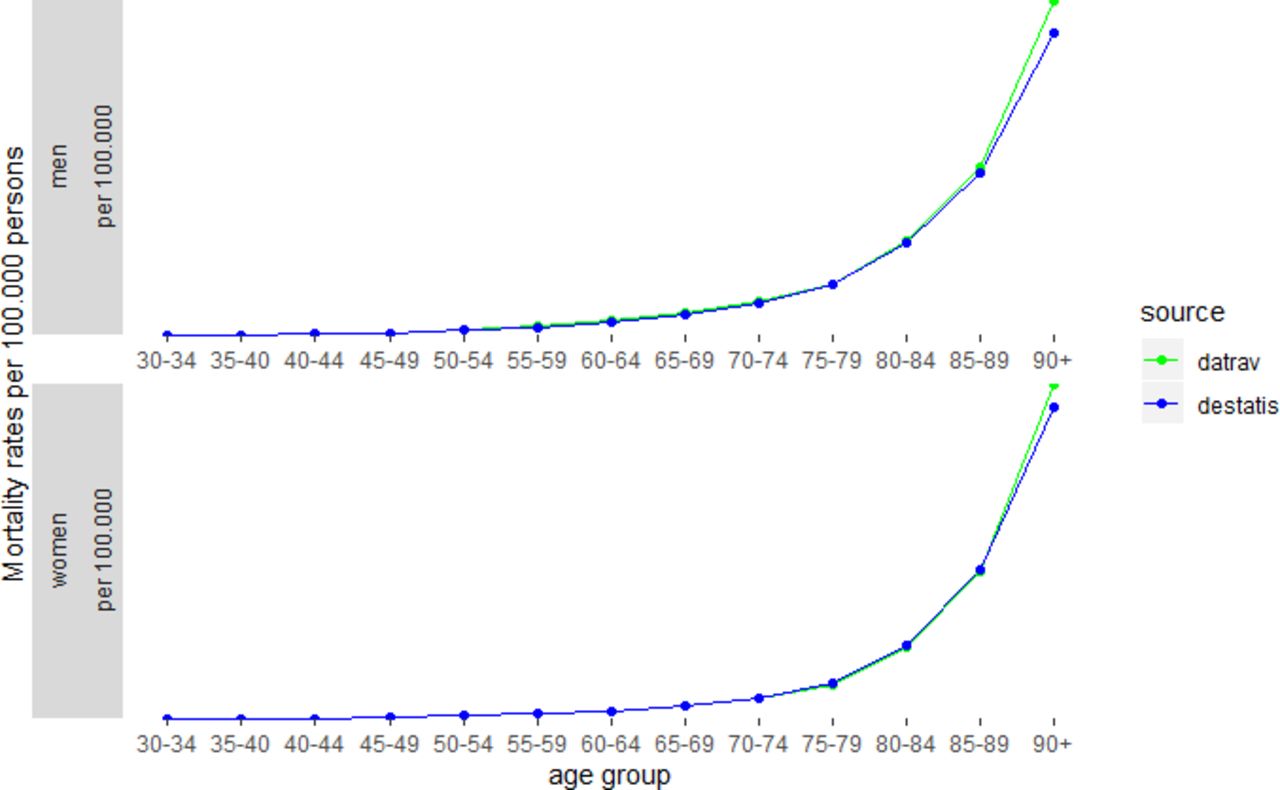
Table 1
Descriptive characteristics of the study population by diabetes status and sex (DaTraV, age ≥ 30 years). See: http://dx.doi.org/10.1136/bmjopen- 2020-041508
Table 2
Sensitivity analyses using modified diabetes case definitions: Number of individuals by diabetes status and age-adjusted mortality rates by sex (DaTraV, age ≥ 30 years). See: https://dx.doi.org/10.1136/bmjopen-2020-041508